Plot a histogram and estimated densities/distributions of Gaussian-based model object
Source:R/gaussmodel.r
plot.gaussmodel.RdPlot the histogram and, if available, estimated densities
or cumulative distributions of gaussmodel object.
Usage
# S3 method for gaussmodel
plot(
  x,
  cum = FALSE,
  nmax = 4,
  graphs = NULL,
  bins = 40,
  hist = TRUE,
  scaling = FALSE,
  linesize = 1,
  ...
)
Arguments
- x
gaussmodelobject.- cum
A logical scalar, whether or not it plots cumulative histogram/distributions instead of plain histogram/densities. Default value is
FALSE.- nmax
A maximum number of estimates to be plotted in the graph. The default value is 4.
- graphs
A vector of indices to be displayed in the graph. These indices appear in the leftmost column of the table in
estimate.gaussmodel. The default value isNULL, and if it is notNULL, only the estimated densities designated bygraphsoption appear, andnmaxis ignored.- bins
A number of bins of the histogram.
- hist
A logical scalar. If
TRUE, display a histogram, otherwise not. The default value isTRUE.- scaling
A logical scalar, which indicates whether or not it scales means and standard deviations in
mulistandsdlist. The default value isFALSE.- linesize
A positive numeric scalar, which indicates the thickness of lines. The default value is
1.- ...
Arguments to be passed to or from other methods.
Examples
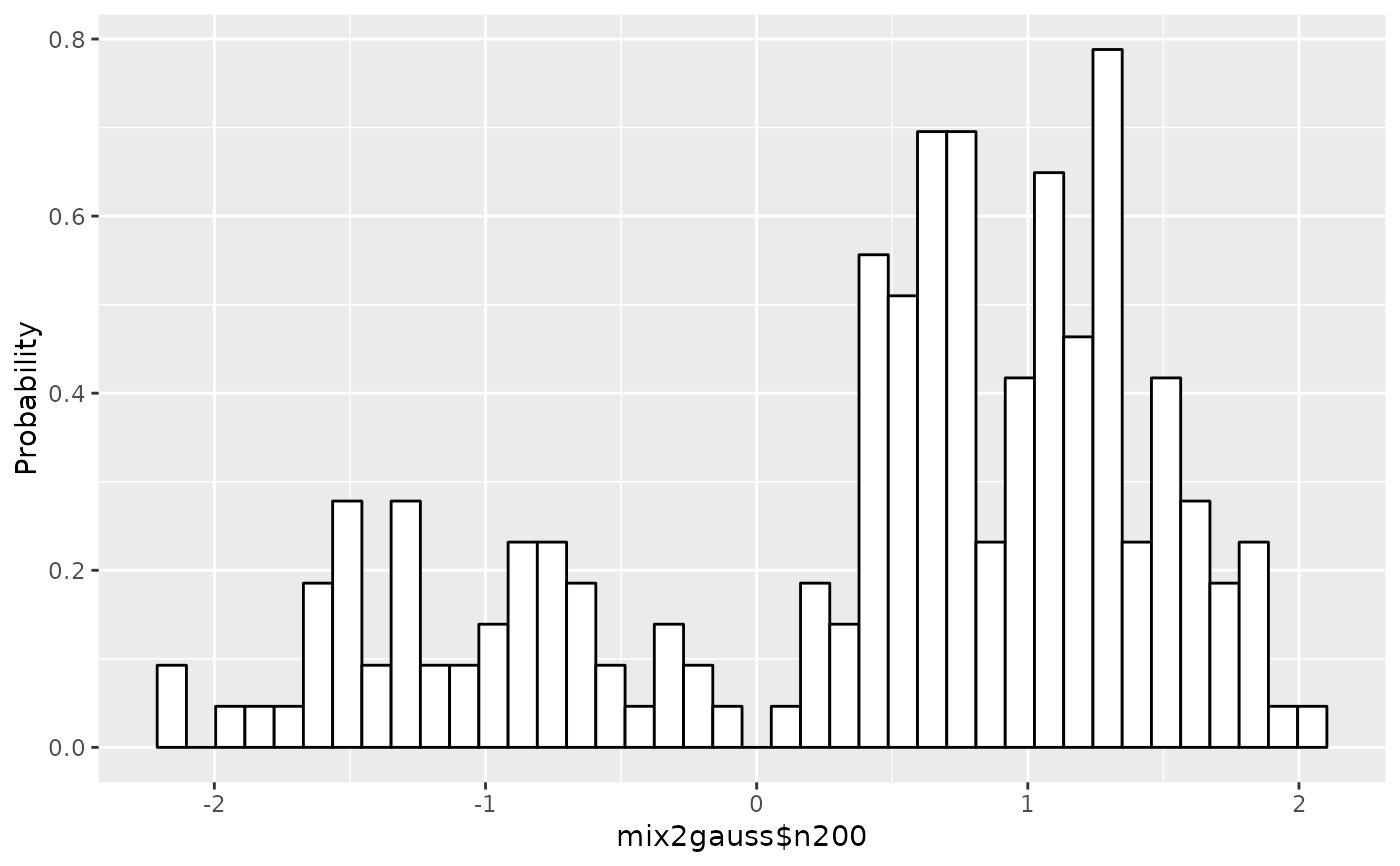
## Create `gaussmodel` object from a data set mix2gauss$n200
gmodel <- gaussmodel(mix2gauss$n200)
## Plot it (histogram only)
plot(gmodel)